
[tdc_zone type=”tdc_content”][vc_row tdc_css=”eyJhbGwiOnsicGFkZGluZy10b3AiOiIyNSIsImRpc3BsYXkiOiIifX0=”][vc_column][/vc_column][/vc_row][vc_row el_class=”td-ss-row”][vc_column width=”2/3″][tdm_block_inline_image display_inline=”yes” media_size_image_height=”1080″ media_size_image_width=”1920″ image=”71175″ caption_text=”SGVyZSUyMGFyZSUyMHRoZSUyMGluY2lkZW50JTIwdG90YWxzJTIwZm9yJTIwZHJpdmVycyUyMGR1cmluZyUyMHRoZSUyMDIwMjElMjBOQVNDQVIlMjBYZmluaXR5JTIwU2VyaWVzJTIwc2Vhc29uLg==”][tdb_header_menu main_sub_tdicon=”td-icon-down” sub_tdicon=”td-icon-right-arrow” mm_align_horiz=”content-horiz-center” modules_on_row_regular=”20%” modules_on_row_cats=”25%” image_size=”td_324x400″ modules_category=”image” show_excerpt=”none” show_com=”none” show_date=”none” show_author=”none” mm_sub_align_horiz=”content-horiz-right” mm_elem_align_horiz=”content-horiz-right” tdc_css=”eyJhbGwiOnsibWFyZ2luLXRvcCI6IjEwIiwiZGlzcGxheSI6IiJ9fQ==” menu_id=”682813929″ tds_menu_active1-line_color=”#ff0000″ tds_menu_active1-text_color_h=”#ff0000″ tds_menu_sub_active1-sub_text_color_h=”#ff0000″][td_block_title title_tag=”h4″ tdc_css=”eyJhbGwiOnsibWFyZ2luLXRvcCI6IjE1IiwiZGlzcGxheSI6IiJ9fQ==” block_template_id=”td_block_template_10″ custom_title=”2021 NASCAR Xfinity Series Incidents” border_color=”#0a0a0a”][vc_column_text tdc_css=”eyJhbGwiOnsibWFyZ2luLXRvcCI6IjE1IiwiZGlzcGxheSI6IiJ9fQ==”]
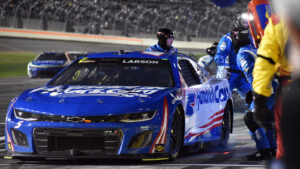
Here is the Toby Tracker (incident tracker) for the 2021 NASCAR Xfinity Series season. In the chart below, you will see which drivers accumulated the most on-track incidents throughout the entire season. To toggle to a different year or series, utilize the “Toby Tracker Menu” bar above.
| Driver | Starts | Incidents | Incidents Per Race |
|---|---|---|---|
| Myatt Snider | 33 | 20 | 0.606 |
| Brandon Jones | 33 | 17 | 0.515 |
| Riley Herbst | 33 | 17 | 0.515 |
| Jeb Burton | 33 | 17 | 0.515 |
| Brett Moffitt | 31 | 16 | 0.516 |
| Ryan Sieg | 33 | 16 | 0.485 |
| Daniel Hemric | 33 | 15 | 0.455 |
| Joe Graf Jr. | 29 | 14 | 0.483 |
| Sam Mayer | 18 | 13 | 0.722 |
| Josh Berry | 22 | 13 | 0.591 |
| Matt Mills | 30 | 13 | 0.433 |
| Jade Buford | 32 | 13 | 0.406 |
| Noah Gragson | 33 | 13 | 0.394 |
| Brandon Brown | 33 | 13 | 0.394 |
| Josh Williams | 32 | 12 | 0.375 |
| Justin Haley | 32 | 11 | 0.344 |
| Alex Labbe | 33 | 11 | 0.333 |
| Justin Allgaier | 33 | 11 | 0.333 |
| Tommy Joe Martins | 33 | 11 | 0.333 |
| Jeffrey Earnhardt | 29 | 10 | 0.345 |
| Harrison Burton | 33 | 10 | 0.303 |
| Michael Annett | 26 | 9 | 0.346 |
| Austin Cindric | 33 | 9 | 0.273 |
| AJ Allmendinger | 33 | 8 | 0.242 |
| Stefan Parsons | 11 | 7 | 0.636 |
| Ty Gibbs | 18 | 7 | 0.389 |
| Jeremy Clements | 33 | 7 | 0.212 |
| Kris Wright | 7 | 6 | 0.857 |
| Cody Ware | 7 | 6 | 0.857 |
| Ty Dillon | 11 | 6 | 0.545 |
| Gray Gaulding | 19 | 6 | 0.316 |
| Colby Howard | 21 | 6 | 0.286 |
| David Starr | 26 | 6 | 0.231 |
| Ryan Vargas | 29 | 6 | 0.207 |
| Caesar Bacarella | 5 | 5 | 1.000 |
| JJ Yeley | 16 | 5 | 0.313 |
| Bayley Currey | 24 | 5 | 0.208 |
| Kyle Weatherman | 30 | 5 | 0.167 |
| Josh Bilicki | 4 | 4 | 1.000 |
| Sage Karam | 4 | 4 | 1.000 |
| Kyle Busch | 5 | 4 | 0.800 |
| Brandon Gdovic | 6 | 4 | 0.667 |
| Santino Ferrucci | 7 | 4 | 0.571 |
| Mason Massey | 13 | 4 | 0.308 |
| Jesse Little | 23 | 4 | 0.174 |
| Spencer Pumpelly | 3 | 3 | 1.000 |
| Will Rodgers | 3 | 3 | 1.000 |
| Dylan Lupton | 4 | 3 | 0.750 |
| Carson Ware | 6 | 3 | 0.500 |
| CJ McLaughlin | 6 | 3 | 0.500 |
| Preston Pardus | 8 | 3 | 0.375 |
| Spencer Boyd | 9 | 3 | 0.333 |
| Timmy Hill | 15 | 3 | 0.200 |
| Landon Cassill | 32 | 3 | 0.094 |
| David Smith | 1 | 2 | 2.000 |
| Chase Elliott | 1 | 2 | 2.000 |
| Chase Briscoe | 2 | 2 | 1.000 |
| Kevin Harvick | 3 | 2 | 0.667 |
| Tanner Berryhill | 3 | 2 | 0.667 |
| Garrett Smithley | 4 | 2 | 0.500 |
| Jason White | 4 | 2 | 0.500 |
| John Hunter Nemechek | 5 | 2 | 0.400 |
| Colin Garrett | 5 | 2 | 0.400 |
| Natalie Decker | 5 | 2 | 0.400 |
| Dexter Bean | 5 | 2 | 0.400 |
| BJ McLeod | 5 | 2 | 0.400 |
| Jordan Anderson | 6 | 2 | 0.333 |
| Chad Finchum | 6 | 2 | 0.333 |
| Ryan Ellis | 6 | 2 | 0.333 |
| Blaine Perkins | 8 | 2 | 0.250 |
| Danny Bohn | 1 | 1 | 1.000 |
| Robby Lyons II | 1 | 1 | 1.000 |
| Zane Smith | 1 | 1 | 1.000 |
| Cole Custer | 1 | 1 | 1.000 |
| Grant Enfinger | 1 | 1 | 1.000 |
| Michael Munley | 1 | 1 | 1.000 |
| Kyle Tilley | 1 | 1 | 1.000 |
| Erik Jones | 1 | 1 | 1.000 |
| Bubba Wallace | 1 | 1 | 1.000 |
| Denny Hamlin | 1 | 1 | 1.000 |
| Sheldon Creed | 1 | 1 | 1.000 |
| Kyle Sieg | 2 | 1 | 0.500 |
| Akinori Ogata | 2 | 1 | 0.500 |
| Christopher Bell | 2 | 1 | 0.500 |
| Patrick Emerling | 3 | 1 | 0.333 |
| Joey Gase | 5 | 1 | 0.200 |
| Stephen Leicht | 5 | 1 | 0.200 |
| Austin Dillon | 5 | 1 | 0.200 |
| Andy Lally | 5 | 1 | 0.200 |
| Matt Jaskol | 6 | 1 | 0.167 |
| Miguel Paludo | 3 | 0 | 0.000 |
| Tyler Reddick | 7 | 0 | 0.000 |
| Loris Hezemans | 4 | 0 | 0.000 |
| Martin Truex Jr. | 1 | 0 | 0.000 |
| George Gorham Jr. | 1 | 0 | 0.000 |
| Ross Chastain | 1 | 0 | 0.000 |
| Boris Said | 1 | 0 | 0.000 |
| Austin Hill | 5 | 0 | 0.000 |
| Ronnie Bassett Jr. | 2 | 0 | 0.000 |
| Jesse Iwuji | 1 | 0 | 0.000 |
| Kaz Grala | 2 | 0 | 0.000 |
| Dawson Cram | 1 | 0 | 0.000 |
| James Davison | 1 | 0 | 0.000 |
| Tim Viens | 1 | 0 | 0.000 |
| Dale Earnhardt Jr. | 1 | 0 | 0.000 |
| Mike Harmon | 1 | 0 | 0.000 |
*This stat is compiled using official NASCAR race results caution information as well as watching replays of races to notice incidents that may not have caused a caution (for instance: pit road collisions, last lap crashes, etc.).
[/vc_column_text][vc_separator tdc_css=”eyJhbGwiOnsibWFyZ2luLXRvcCI6IjI4IiwibWFyZ2luLWJvdHRvbSI6IjIwIiwiZGlzcGxheSI6IiJ9LCJwaG9uZSI6eyJkaXNwbGF5IjoiIn0sInBob25lX21heF93aWR0aCI6NzY3fQ==”][tdb_single_post_share tdc_css=”eyJhbGwiOnsiZGlzcGxheSI6IiJ9fQ==” like_share_style=”style17″ like=”yes”][vc_separator tdc_css=”eyJhbGwiOnsibWFyZ2luLWJvdHRvbSI6IjMwIiwiZGlzcGxheSI6IiJ9LCJwaG9uZSI6eyJkaXNwbGF5IjoiIn0sInBob25lX21heF93aWR0aCI6NzY3fQ==”][/vc_column][vc_column width=”1/3″ is_sticky=”yes”][td_block_social_counter custom_title=”Stay Connected” twitter=”tobychristiecom” youtube=”channel/UC_2nAXNJ6fLNFHN6ThaMF-Q” block_template_id=”td_block_template_8″ border_color=”#dd3333″ style=”style5 td-social-boxed” open_in_new_window=”y” facebook=”tobychristiecom”][/vc_column][/vc_row][/tdc_zone]